Social Complexity

Category: Posts

Howe to get a Marie Curie fellowship – Part 1

From the number of emails I am receiving, I guess it is that time of the year where researchers start writing their application for the Marie Sklodowska Curie Action – Individual Fellowship (MSCA-IF or just MC if you do not like long acronyms).

Since I get always similar questions, I decided to summarize them here together with their answers. I hope you will find them useful!

(Very similar content is available also in this video!)

Am I good enough?

Before even getting into the tips and tricks, let us face the first common question: “am I good enough?” And the short answer I usually give is: yes and no. Let us try to see why.

I do not know you personally, but I think most scientists have the potential to produce a really high-quality submission. So, most likely you are in this group, congratulations!

Even if we run away from the gym with the excuse that we are too busy, a similar approach applies here: if you want results, you need to sweat!

The problem, however, is that your first drafts are going to be terrible. Nor even close to what you will need to achieve. So you will have to re-draft it almost from zero several times just to produce something that will look like an MC application.

So, do not worry: you do not need any superpower. What you need are the right approach and a ginormous amount of work. Here I will take care of explaining the approach; the rest is up to you.

Are you ready?

What you actually need

Tons of hours of work aside, I think there are 3 points which are fundamental for approaching this type of work. “Fundamental” means that if you lack any of them you are really likely to be out. These points are:

  1. The right mindset
  2. The right project
  3. The right CV

Let us start with the first!

1. The right mindset

A lot of courses on writing articles and grants start telling you to be positive and believe in yourself. Personally, I think this is a big mistake.

The first problem is that many of us do not feel like anything special. And the more someone tells us “you are so amazing!” the worse we feel. Indeed, we may even feel the urge to explain in details how average (or even below this level) we are.

The other problem with this approach is more related to logic and math: if everyone is amazing, then it means we are just average. And remember: your application does not need to be “as amazing and unique as everyone’s else.” No, it needs to score in the top 10%.

So, here I will not try to force you to think that you are special, that you are made of dead stars (this statement is true for anything on Earth, including garbage, by the way) or other hyper-positive stuff.

The only requirement for finding the right mindsets is to use a little imagination. Indeed, you need to imagine two characters and, little by little, you should learn to act like them.

Let us meet the first one!

The cool one

Many of us have a friend who always acts like everything she does is amazing. She presents even the most mundane events as something impressive. This is sometimes annoying but it is also the kind of mindset we need for completing several tasks that will lead us to our fellowship.

If you do not have a friend like this, you may also look at this video which shows a little the style we need 👇👇👇

When you will write your application, you should ask yourself: “how would The cool one write this sentence? How would she explain this concept?”

And let me be clear about this point: this is not about lying. Indeed, if you published 1 article you will not write anything like “I published 10 articles.” Nor will you try to mislead the reader into thinking something that is not true (to me that is still lying, even if what you wrote is technically the truth).

This mindset is about finding the cool sides of everything. For example, you may have published only one article, but it may be in a very good journal. Or maybe you were invited for writing it. And what if it got a lot of citations? That is definitely something you should mention in the application!

As I am a boring person, while describing myself, I would probably say something like: “I graduated from the X university.” But the cool one would write something like: “I graduated from a university which was listed in the top 10% of my country.” Or “I was in the top 5% students of my course.” Etc.

You do not know how you or your university ranked? Find those numbers! I told you it was a long task, but you need this to be able to write as you were the cool one.

The grumpy one

“Oh, you published on Nature? Well, every month Nature publishes a lot of articles, so you are just one of many.” For the grumpy one everything is flawed, or uninteresting; probably both.

Her help is fundamental for identifying what is not working in your application. Indeed, if you spend too much time as The cool one, you may think that your application is already pretty good and you can just do some minor adjustments. That would be a big mistake.

Rewrite, rewrite, rewrite! There are no shortcuts.

The right balance

Ok, now we have our two characters, so what should we do with them?

The first important thing is to not overdo it. Indeed, an excess in self-esteem would lead to just indulging in how great you are. Vice versa, an excess of criticism will lead to paralysis and thinking crap like: “I’ll never be able to get in the top 10%. I should just give up.”

For each new version, you will need the grumpy one to find what needs to be changed. Then, you will have to switch to the cool one and start writing about how great you and your projects are. Just, try to find an even better way to explain it in this new version. After all, you get more and more amazing with every single breath!

In the beginning, you will need the full power of the grumpy one. Indeed, you will have to re-draft the application from scratch several times. Yes, you do. I know you hate this idea, but do not listen to me, listen to the grumpy one: “do you really think something like that would get accepted? Do you really believe it would get into the top 10%? Ok, then sit down and re-draft it.

However, as you go further, you may want to decrease the criticism more and more. Indeed, in the last versions, you should have smaller and smaller changes. In this way, your work can converge to a pretty solid piece.

Congratulations!

2. The right project

When I participated to the MSCA Falling Walls competition, I remember a participant complaining about the MC funds. He was complaining that only projects on trendy topics would get funded. And I think he was right, but that was not a good reason to be angry.

Agencies will not fund your project unless it is really important

Let us make this clear: most funding agencies are not funding research per se. The world has pretty big problems: people are dying of hunger, we got climate change, cancer, TV series without an ending, etc. So, it is really difficult that someone will fund a useless project.

But my project is not useless. It solves the problem of X, Y and Z.” Then you have to be explicit about this. You have to show that your project is important and that it deserves to be funded. You have to clearly tell the reader that they are not just paying your salary. They are investing money to make the world a better place.

What if my project is not solving any important issue?” In that case, consider changing slightly your project. In many cases, you may introduce little changes to make it 100 times more interesting.

For example, my initial idea for my project was about models for predicting social behaviour. Since these models could be used also for addressing problems like vaccine hesitancy, I decided to focus on that. In this way, I still have to work on the models. However, the final impact of my project would not be just the introduction of new models but addressing the problem of vaccine hesitancy.

3. The right CV

“Ok, ok, ok, your project sounds pretty awesome. However, why should we give money to you? Why cannot we just find a better researcher for this (or a similar) project?”

Many people think that to get funded you need to show that you are amazing. However, even if you are able to show how great you are, you may still not be fitted for the project.

I think my story here is a pretty good example. Indeed, for my MC application, I come up with this cool project about exploring vaccine hesitancy using models of social behaviour. But there was a big problem: my background was in physics, which is totally unrelated to the project.

An extra down point was that I used to change subject quite often in the past: from quantum optics to microfluidics to biophotonics. This would have shown some lack of consistency and expertise.

If would have presented it like this, I am pretty sure now I would have no fellowship. Indeed, the committee would have thought that I was not fitted for such a project.

To show the opposite, I stressed the fact that in all my previous projects I took care of developing mathematical and computational models. So, even if I was no expert in quantum optics or microfluidics, I was actually extremely skilled in modelling.

Furthermore, as I worked in different fields I also learnt many different modelling approaches. So my modelling background was extremely vast and flexible.

As you can see, here I used the approach of the cool one to show a piece of truth that I did not immediately see: I was actually a perfect fit for the project. But I had to work pretty hard to figure this out! And if you want your application to be awarded, you will need to learn to do the same.

4. Do you need a template?

When I was writing my application another previous awardee was so nice to share with me his application. So I took a deep look into that… and I figured out it was totally useless to me.

The problem with these applications is that each one is 100% tailored to conveying a really specific message (and project). So it is almost impossible to take one submission and reshape it or use it as a template. Even taking it as inspiration is more work than just starting from scratch. It is like studying a car for understanding how you should build a spaceship. Yes, they are both vehicles. No, they do not have much in common. Just forget the car and start working on your spaceship.

However, in a future article, we will discuss how to write down each section in the way that fits your project in the best way.

5. External help

In this post, I wrote a lot of “I.” “I have done this and that…” but it is not the whole truth. A huge help was given to me by my supervisor and by the research funding officer. Without their help, I would have probably sent my terrible first or second version… and failed miserably.

This paragraph is not just for thanking them, but it is mostly to tell you that you can do the same. Doing it alone may be really too much and you may not be really good at switching between the two characters. So do not be afraid to ask for help and comments. Many people in this field know a lot of tricks.

6. The next steps…

Please, let me know if you have any comment or questions on this.

As mentioned, I plan to write part 2 in which I go more into details on how to write the application and how to tailor each section to your project. So, every suggestion is welcome.

Until next time, good luck with your application!

How measurements change your data’s shape

This image has an empty alt attribute; its file name is image-1.png

The way we measure effects in the social sciences may be way more important than what you think…


This post is for a broad academic readership


The mystery of the top earners

Just yesterday I came across this post from the NeuroNeurotic blog. The idea is very interesting as it discusses how some “psychological effects” may actually not be psychological at all. Instead, the effect may appear just from some data manipulation (aka an artefact).

The blog’s post takes a look at this other article from the Guardian. Here a study shows how the top earners in Germany believe their earnings are almost the average ones. This claim is someway supported by this pretty cool visualization:

On the left, people are divided in deciles. For example, the maximum decile (i.e. 10) would be the top 10% earners. On the right, we have some kind of perceived income. (More details later!)

The problem we now face is: are we sure this picture is telling the truth? Which can be reformulated in: “do we really need some psychological effect to obtain this graph? Or can it be obtained just from data manipulation?”

NeuroNeurotic’s solution

According to the NeuroNeurotic blog, the previous image does not really support the claim. Indeed, it may just be an artefact due to binning.

For those who do not know yet this binning guy, he is just the cousin of rounding. Indeed, when we round, we take a lot of numbers and collapse them into fewer groups. For example, all the numbers from 1.5 to 2.499 will be grouped into the number 2.

Similarly, we may take person 1 to 1,000 and put all of them into the same bin/group. Thus, deciles are a way to group people into 10 bins.

Representation of how we may bring an entire population into 2 bins.

The main idea behind the blog’s argument is that binning is putting in the same group people that, maybe, should not be together. For example, the top decile will contain people which may have gigantic differences in earnings. Thus, averaging these values together will bring them closer to the mean value.

For a more detailed explanation, you may look at the original post. However, what I found extremely interesting is how the author was able to reproduce a similar image in simulations even without any psychological effect!

Indeed, he assumed that the distribution of earnings followed a normal (aka Gaussian) distribution. Then, he assumed that every person is just answering their real earning and collected the average value per decile. The striking result is the image below.

My question this time is: is the simulation really reproducing the results from the article? Which can also be restated as: “is it just a matter of binning?”

The surprising effect of binning

Let us try to simulate something slightly different now. Earnings are still normally distributed like before, and people are still divided into deciles (i.e. binned). However, this time we ask people: “in which decile of the population do you think you are?

This means that in the previous simulation everyone was answering her own earnings. Now, everyone will answer her own decile. Similarly to the previous simulation, also here everyone is answering correctly (i.e. no errors or effects).

The interesting fact is that if we run this simulation, we obtain the following image. Why? In this case we still have binning but the result disappeared!

The short answer is that everyone is just answering her own decile. So all the people in the 10th decile are answering 10 and the mean value would still be 10.

The longer answer is that we are actually facing a problem of measurement…

A problem of measurement

What was not really clear here is that we are currently dealing with two different scales of income. The first scale is just the earnings and it is measured in dollars. Meaning that if I earn 1,000 $ and you earn 5,000 $, the difference between us would be 4,000 $.

However, there is also a second hidden scale: ranking. In this scale, each person receives a score (aka number) according to how they place. For example, the poorest person would be number 1, the second-poorest would be number 2, etc.

To understand why this difference is important let us take the two poorest people in the simulation. Let us say one has 1 cent and the other has 5 cents. Thus, their difference in dollars would be 4 cents. However, their difference on the ranking scale would be 1.

This difference of 1 would also be the difference between the two richest. However, their difference in dollars may be of some millions or even billions.

This tells us that the relationship between the two scales is someway weird. This “weirdness” is called “non-linearity” in mathematical terms, but let us stay away from obscure mathematical concepts.

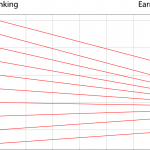
Instead, let us plot the relationship between the ranking and the dollar scale. Does it look someway similar to something else? Notice how most of the lines are again tilted towards the center!

What we just observed is the fact that when we change scale we produce some distortions on the graph. This may result in compression (e.g. all the lines going towards the centre) or expansion depending on the two scales.

Furthermore, if we bring back our old friend Mr. binning, we will be back to our initial effect. As you see, for example, the top line is not horizontal anymore as it has been averaged with the other top 10% lines.

So what?

Our analysis shows us some little interesting facts:

  1. Binning alone is not sufficient to produce the effect in the article. Indeed, it would result in straight horizontal lines.
  2. Scale transformation is a beautiful way to create a mess. Indeed, the relationship between the two scales would look like a mishmash of tilted lines.
  3. Scale transformation + binning is the ultimate key for a disaster. One creates a mess while the other averages it out partially. This creates a cool relationship between the two scales which may be confused for an effect.

Then, is the study wrong?

The short answer is: “we don’t know.” Actually, everything depends on the question that was asked to participants.

If the authors asked “what decile do you think you belong to?” then everything is fine. Indeed, the two scales would be decile VS perceived decile. Here we have no scale change and binning alone cannot do anything to explain this.

For example, the study showed that the top decile answered an average of 6.5. This means that, roughly, people in the top 10% think they are only in the top 40% and that there are still 30% of people richer than them. This bias is definitely an interesting psychological effect!

However, what if they asked something that made people think in terms of earnings instead of ranking? In that case, the plot would be affected by scale transformation. Indeed, the first column would be a ranking while the second would be an earning scale! Thus, we would have all the ugly effects we discussed before.

For example, we may ask “on a scale 1 to 100 how does your earning compare to the richest person? With 100 being the same earning as the top one, 50 being half of it and 1 being 1/100 of it.

Let us suppose the richest person earns 1 million and the second richest earns 0.7 millions. Even without any psychological effects, person one will answer 100 and the second will answer 70. Thus, the line of the top earners would not be horizontal but tilted towards 50!

In conclusion

Always be careful of how you measure things, especially in the social sciences. Indeed, changes of measurement have the potential of messing things pretty badly.

Next time we will discuss about another effect that may be present in this study!

Until then, let’s stay rational!

Related topics:

Making people understand COVID’s data

During these days of quarantine, a hard task is to keep people informed. The main problem comes with the nature of the data that are usually misleading. Indeed, while people can easily understand the concept of new cases or number of deceased, these values are not representative of the real growth. Indeed, the number of cases has a clear exponential growth.

A solution is using the growth rate, as many are doing now. Unfortunately, this is a quite abstract concept and most people do not have any idea of how big a rate of 30% actually is. And even if we say that this rate decreased by 80% they still have no clue how good this is.

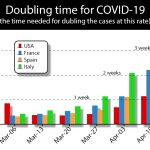
With Social Complexity Labs we decided instead to use a more understandable measurement: the doubling time. That is the time needed for doubling the number of cases at that specific rate. We express it in days and months, so people can directly quantify the increase.

Furthermore, we are also working on making the graphs aesthetically pleasing. (All of this is part of our project on better scientific communication).

The results look like this:

Or this:

If you like the idea feel free to re-use the images or apply the doubling to your graphs!

Powered by WordPress & Theme by Anders Norén